
When will the project be finished? What happens if one task is delayed by a week? Who will have the most work in March? These questions are answered by the Gantt chart, one of the oldest and still most widely used project planning tools.
In this article, we will explain what a Gantt chart is, when it is useful, and how to use it to plan a project in five steps.
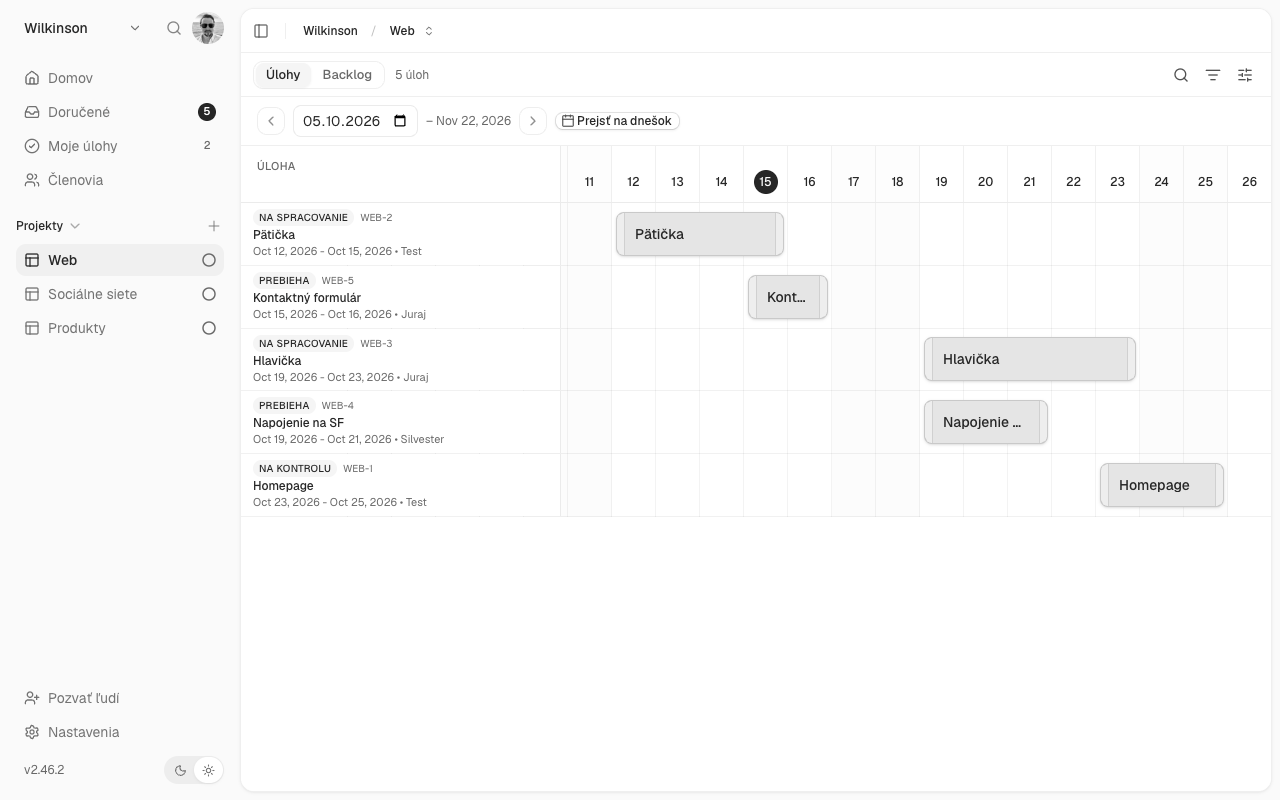
What is a Gantt chart?
A Gantt chart is a project timeline displayed as horizontal bars. The vertical axis represents tasks, and the horizontal axis represents time. Each task is a bar that starts with the date it is started and ends with the due date.
The diagram is named after the American engineer Henry Gantt, who popularized it in the early 20th century. A similar tool, the schedule, was previously designed by the Polish engineer Karol Adamiecki. The principle has hardly changed since then, because it works.
At first glance you can see from it:
- what is done when,
- which tasks are running simultaneously,
- which tasks follow each other,
- when will the project be finished.
When is a Gantt chart useful?
A Gantt chart is useful when order and dates It depends. For example:
- Projects with a fixed deadline: opening of operations, website launch, trade fair, handover of the building.
- Projects where tasks follow each other: You cannot print the catalog until the photos and text are ready.
- Projects that multiple people or companies are working on: graphic designer, programmer, printer, client.
- Capacity planning: you need to see who will be overloaded in which week.
On the other hand, it is not very suitable for ongoing work without fixed deadlines, such as regular customer support or recurring tasks. A Kanban board is better for that.
How to plan a project in five steps
Let’s show this with an example: new company website, which must be completed by the end of the month.
Step 1: Break down the project into tasks
Write down everything that needs to be done. Tasks should be small enough to be estimated, ideally within a day to two weeks.
Example:
- Collection of documents from the client
- Website structure design
- Graphic design
- Lyrics
- Photo
- Programming
- Testing
- Launch
Step 2: Estimate the duration of each task
For each task, write down how many days it will take. Be realistic and allow for a margin. The most common planning mistake is assuming that everything will go according to plan.
Step 3: Determine what follows what
Some tasks cannot start until another is finished. Graphic design does not start before structural design. Programming does not start before graphic design. However, text and photos can be done at the same time as graphics.
These relationships are what make a Gantt chart so useful. You can see which tasks can run in parallel and which cannot.
Step 4: Assign responsible persons
Every task needs a person to be responsible for it. When you have tasks assigned, you can also see if someone has too many things planned for the week at once.
Step 5: Visualize the plan and find the critical path
Once you have tasks, durations, and relationships, create a diagram of them. The longest chain of tasks that follow each other is called critical path. It determines the earliest time a project can be completed. Any delay to a task on the critical path will delay the entire project.
In our example, the critical path is: documentation → structure → graphics → programming → testing → launch. Text and photos are not on it, so you have a little margin there.
Gantt chart in Excel or in an app?
Many companies create a Gantt chart in Excel. For a simple plan, this is sufficient. However, Excel has limitations:
| Excel | Project management application | |
|---|---|---|
| Change of date | you manually retype cells | move the bar with the mouse |
| More people at once | difficult, the file is sent by email | everyone sees the current status |
| Link to tasks | none, the plan is separate from the work | the bar is directly a task with comments and a deadline |
| Deadline reminders | none | automatically |
| Different perspectives on the same work | new tables need to be made | board, list, calendar |
The biggest problem with Excel is that the plan stops updating after a few weeks. The real work happens elsewhere, in emails and messages, and the spreadsheet gets left behind. In the app, the timeline is just a different view of the same tasks that the team works on every day, so it’s always up to date.
The most common planning mistakes
- A plan without reserve. Something will always go wrong. Add a margin, especially for tasks that depend on the client or supplier.
- Too detailed a plan. Nobody reads a diagram with hundreds of lines. Details belong in subtasks, not on a timeline.
- A plan that is not updated. A Gantt chart is only useful when it reflects reality.
- Ignoring ties. If you don’t know what follows what, you don’t know what will cause the delay.
Timeline in Projecc
In Projecc, the Gantt timeline is one of the project views, just like the board, list, and calendar. It’s not a separate plan to maintain, but a view of the same tasks that the team is working on. When a colleague changes a task’s due date, the change is immediately reflected in the timeline.
Unlike some well-known tools, where the timeline is only available in more expensive plans, in Projecc it is included in the price. It’s all in Slovak and works in the browser.
Try Projecco for 14 days free, without a payment card.